March 6, 2015 by Jeroen Arnoldus
How to interpret OS X Crash Logs using LLDB

Debugging kernel extensions surrounds you with less comfort as debugging applications running in user space. You can’t use debugging environments offered by IDEs and if a crash occurs, your computer will even shut down; The Kernel Panic. Especially, when you have shipped kernel extensions, such as drivers, these kernel panics are really undesired. However, as kernel programming is highly complex and most code runs in different threads, and memory allocation should all be handled by the programmer, one cannot easily avoid these panics. When you code is shipped to dozens of different configured systems, it is just a matter of time of your first user, or client, will report a Panic. You receive a report, which is cryptic for your client, and also for you… The report only contains hex-numbers, and you are expected to be the expert who can read them. This blog will help you understand OS X Crash Log reports. How you can read them, and how they will help you improve your OS X kernel extensions.
1. The Crash Log Report
Debugging an extension starts with the crash report. The report looks cryptic, but contains all information you need to reconstructed the location where the crash occurred. Actually, the crash report is a stack trace without symbols (like function names) and it contains all information to look up these symbols using the LLDB debugger.
Look at the following error report:
*** Panic Report ***
panic(cpu 2 caller 0xffffff801265c266): "A kext releasing a(n) IOUSBInterface has corrupted the registry."@/SourceCache/xnu/xnu-2782.20.48/libkern/c++/OSObject.cpp:219
Backtrace (CPU 2), Frame : Return Address
0xffffff811e9a3d30 : 0xffffff801212bda1
0xffffff811e9a3db0 : 0xffffff801265c266
0xffffff811e9a3e00 : 0xffffff7f94857b6f
0xffffff811e9a3e20 : 0xffffff7f948579df
0xffffff811e9a3e40 : 0xffffff7f94857255
0xffffff811e9a3e70 : 0xffffff80126b3cad
0xffffff811e9a3eb0 : 0xffffff80126b379f
0xffffff811e9a3f30 : 0xffffff80126ae553
0xffffff811e9a3f70 : 0xffffff80126b4443
0xffffff811e9a3fb0 : 0xffffff80122125b7
      Kernel Extensions in backtrace:
         nl.repleo.osx-ch341(1.0)[C7A7FB19-256A-3FAA-9D05-AEF4EE7131DD]@0xffffff7f94856000->0xffffff7f94860fff
            dependency: com.apple.iokit.IOUSBFamily(720.4.4)[0D6EABE6-1CC7-348C-8BE2-AF04F66722BF]@0xffffff7f92e23000
            dependency: com.apple.iokit.IOSerialFamily(11)[0453BE0D-DB4F-3A51-9CFC-9A93615CCF3E]@0xffffff7f93134000

BSD process name corresponding to current thread: kernel_task

Mac OS version:
14D136

Kernel version:
Darwin Kernel Version 14.3.0: Mon Mar 23 11:59:05 PDT 2015; root:xnu-2782.20.48~5/RELEASE_X86_64
Kernel UUID: 4B3A11F4-77AA-3D27-A22D-81A1BC5B504D
Kernel slide:     0x0000000011e00000
Kernel text base: 0xffffff8012000000
__HIB  text base: 0xffffff8011f00000
System model name: MacBook8,1 (Mac-BE0E8AC46FE800CC)
It contains the following information:
- The exception message and its stacktrace;
- The kernel extensions mentioned in the stacktrace including the memory location where they are loaded;
- The OS X kernel build version;
- The memory locations where the kernel is loaded.
2. Prerequisites for using LLDB to symbolicate the kernel panic
The debugger LLDB is the preferred tool for OS X to perform advanced debugging activities like analyzing crash reports. Before you can use LLDB to symbolicate the crash report, you need to collect the symbolicated binaries of all code of interest. In this example: the kernel, and the osx-ch341 driver.
To get the symbolicated kernel, visit the developer download site of Apple: https://developer.apple.com/downloads/index.action?q=Kernel%20Debug%20Kit. The kernel kit required for this example is version 10.10.3 (14D136), as can be read in the crash report. After running the installation program, the symbolicated kernel is stored in /Library/Developer/KDKs/.
Second, you need symbolicated kernel extensions. Make sure that your kernel extension is compiled with all debugging symbols enabled.
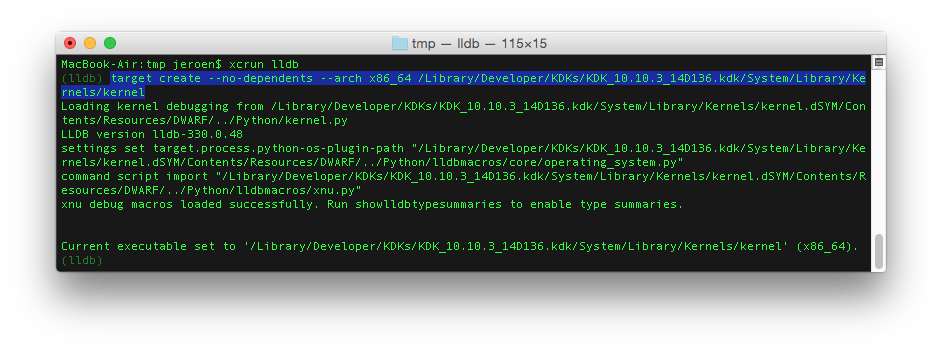
3. Starting LLDB and loading modules
It is now time to start LLDB. Open a terminal, and provide the command: xcrun lldb. You will see the prompt: (lldb). Load the kernel of the crash log: target create --no-dependents --arch x86_64 /Library/Developer/KDKs/KDK_10.10.3_14D136.kdk/System/Library/Kernels/kernel
Load the kernel extension(s) you need to interpret the stacktrace of the crash report: target modules add /tmp/osx-ch341.kext/Contents/MacOS/osx-ch341
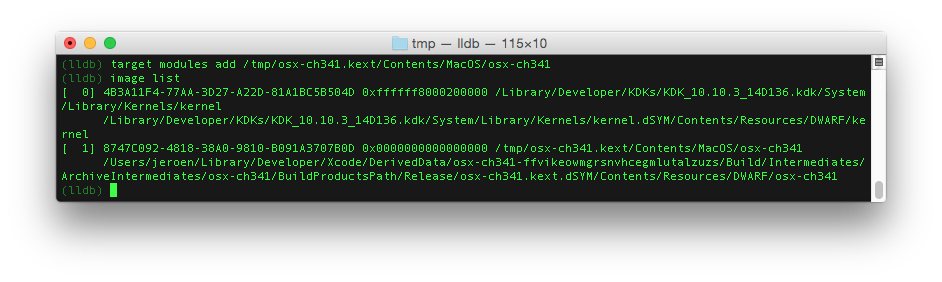
You can check that the modules are loaded using the command: image list. When running this command, you will see the modules are loaded at default memory locations. To use the modules for the earlier showed crash report, we need to set the memory locations to the ones mentioned in the crash report.
Following the crash report, the kernel slide is loaded at 0x0000000011e00000 and the ch341 kext drivers offset start at 0xffffff7f94856000. To set the offsets of the kernel we need to run the following commands: target modules load --file kernel --slide 0x000000000b600000 and target modules load --file osx-ch341 __TEXT 0xffffff7f898fb000.
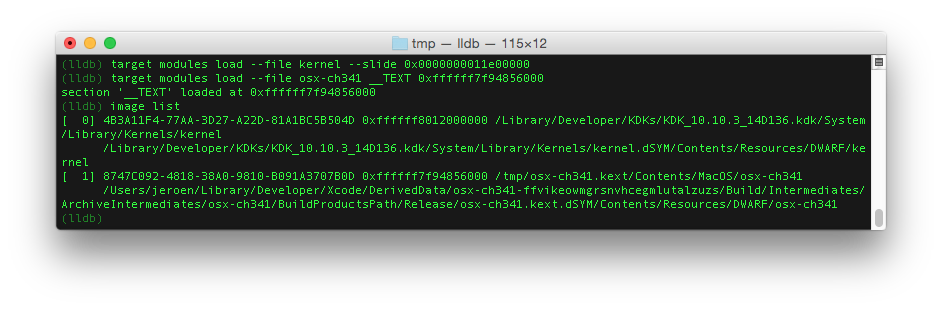
You can verify the offsets are correctly set by using again the command: image list.
4. Symbolicate the stack trace
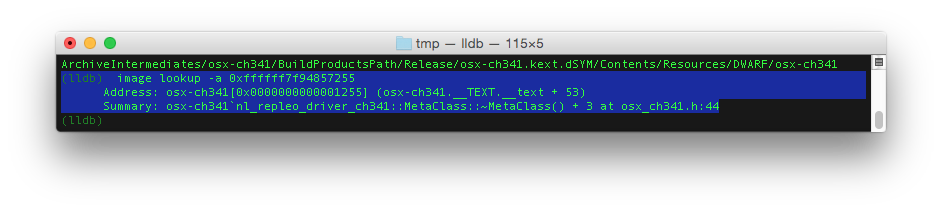
LLDB is now ready for decrypt the crash log reported by the kernel. The stacktrace shows a list of return addresses. In this case we are only interested in the return addresses of our ch341 driver. That are the addresses in the range of 0xffffff7f94856000->0xffffff7f94860fff. The image lookup -a command will show where these numbers point to.
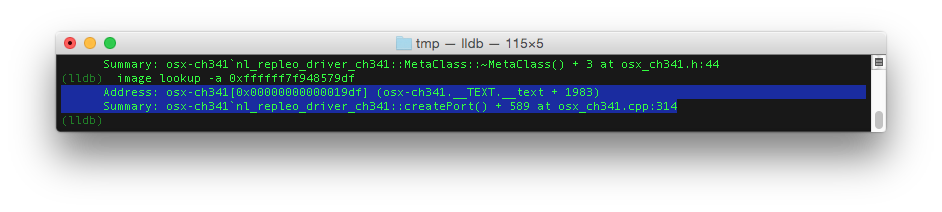
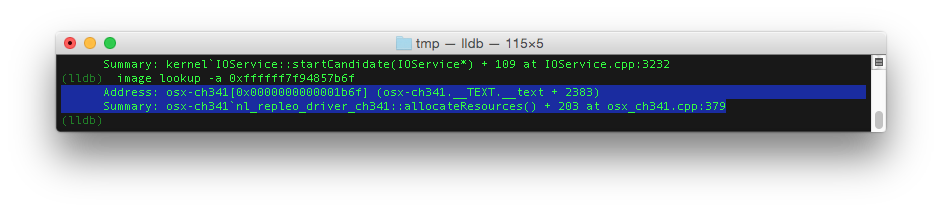
In our example we can build up this part of the stacktrace:
osx-ch341 nl_repleo_driver_ch341::MetaClass::~MetaClass() + 3 at osx_ch341.h:44osx-ch341 nl_repleo_driver_ch341::createPort() + 589 at osx_ch341.cpp:314osx-ch341 nl_repleo_driver_ch341::allocateResources() + 203 at osx_ch341.cpp:379
This stack trace points to the code causing the panic, and now we are able to solve the problem, or prevent a crash by adding failure handling.
5. conclusions
We showed how you can symbolicate crash logs of OS X using LLDB. Crash logs can provide relevant information about problems in your kernel extensions.